Customer Echo / Learn

NPS & CSAT Tracking Software

NPS and customer satisfaction tracking, period comparisons, and automated reports

Book a demo

Good experiences start with listening.

A physical screen displays NPS +42, 100 responses, 64 promoters and 22 detractors.
Customer EchoPromoters − DetractorsNPS

Built for the way you work

Customer Satisfaction Scoring & Comparisons

Customer Echo brings NPS responses, customer satisfaction and feedback into one view. Track scores as responses arrive, compare reporting periods, and read the customer comments behind a change. Automated calculations and reports help your team understand the results and decide where to follow up.

From collection to analysis—complete satisfaction measurement

A customer selecting a recommendation score on a Customer Echo tablet
NPS question
How likely are you to recommend us?

A 0–10 rating, followed by the reason behind it.

Customer EchoRecommendation scoreThe reason why

01 / NPS & Satisfaction Scoring

Built-in NPS Surveys

Ask customers how likely they are to recommend your business on a 0–10 scale. Keep their recommendation score alongside their feedback so your team can understand the experience behind the number.

  • A familiar 0–10 recommendation scale
  • Scores collected alongside customer feedback
  • Promoter, passive and detractor groups
  • Optional written feedback for more context
Changing recommendation scores with enough context to interpret them.
+42 NPS
A score with the responses behind it.

64 promoters − 22 detractors, out of 100

Customer EchoResponses over timeNPS trend

02 / NPS & Satisfaction Scoring

Real-Time Score Tracking

Monitor NPS, CSAT, and custom satisfaction scores as they update in real-time. Live dashboards show current scores, trends, and distribution, enabling immediate response to satisfaction changes.

  • Live score updates as feedback arrives
  • Visual trend charts show score evolution
  • Segment scores by location, product, or team
  • Custom metric creation for industry-specific needs
An NPS calculation subtracts 22% detractors from 64% promoters to give +42; 14% passives appear separately.
+42
See how the score is calculated.

64% promoters − 22% detractors

Customer Echo64% − 22%+42 NPS

03 / NPS & Satisfaction Scoring

Automated Score Calculation

All satisfaction metrics calculated automatically using industry-standard formulas. NPS promoter-detractor calculations, CSAT percentages, and CES scoring happen instantly without manual work or spreadsheets.

  • Automatic NPS calculation (Promoters - Detractors)
  • CSAT percentage scoring with customizable scales
  • Customer Effort Score (CES) tracking
  • Custom scoring formulas for unique metrics
An NPS report compares plus 42 this week with plus 35 the previous week, with 100 responses in each period.
Score context
Compare a score in context.

Read the period comparison alongside the response counts.

Customer EchoTwo periodsA score comparison

04 / NPS & Satisfaction Scoring

Score Comparisons

Compare your NPS across reporting periods and feedback points. Review the response counts and customer feedback alongside each result to understand what changed.

  • Compare the current and previous reporting periods
  • Keep response counts beside each score
  • Filter the view by feedback point
  • Read the feedback behind a score change
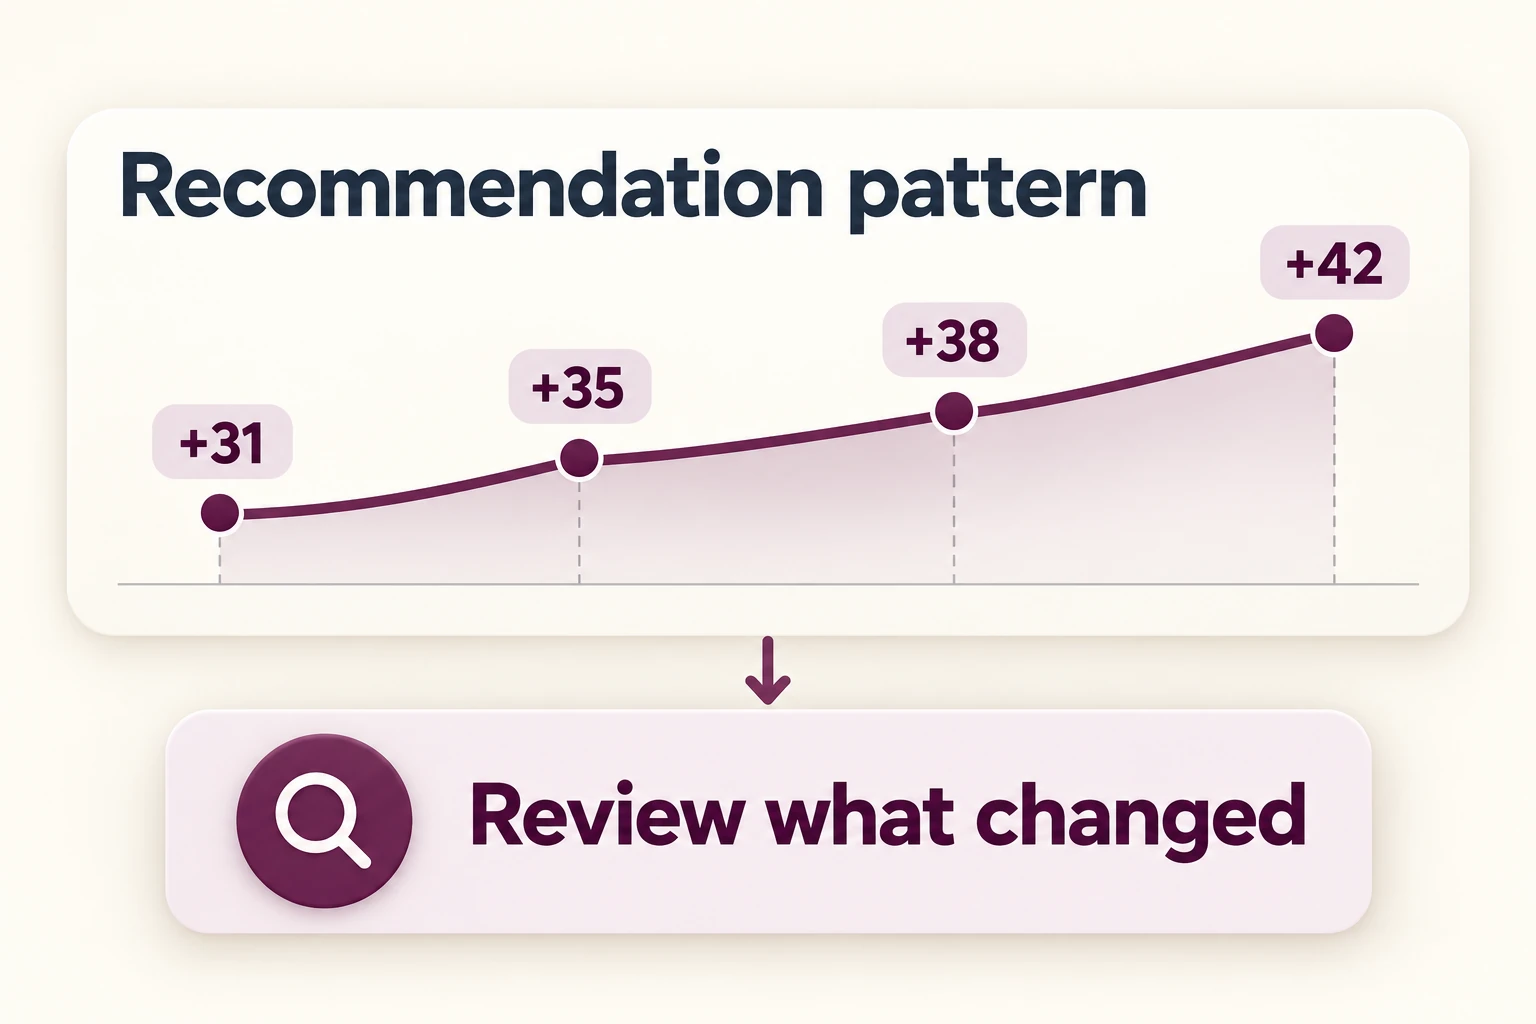
Recommendation scores rise from +31 to +35, +38 and +42, prompting a review of what changed.
Notice a changing pattern.Mentions · Mon–Sun
Customer EchoA changing scoreReview what changed

05 / NPS & Satisfaction Scoring

Follow historical NPS and satisfaction results over time. Review changes alongside response counts and customer comments to decide which experiences need a closer look.

  • Historical score trends across reporting periods
  • Changes shown alongside customer responses
  • Feedback context for improving or declining scores
  • A clearer basis for your next team review
A weekly score report includes NPS plus 42, CSAT 4.2 out of 5 and the promoter, passive and detractor breakdown.
Team report
Share the score and the story.

Weekly summary: score, response volume and recurring themes.

Customer EchoReporting periodScores and responses

06 / NPS & Satisfaction Scoring

Automated Score Reporting

Comprehensive NPS and satisfaction reports delivered automatically. Daily, weekly, or monthly reports include score trends, segment analysis, and AI-generated insights ready for executive presentation.

  • Scheduled reports delivered to stakeholders
  • Executive dashboards with key metrics
  • Trend analysis with period comparisons
  • AI-generated insights and recommendations

The difference in the everyday

Systematic Scoring for Every Industry

Track and improve satisfaction scores across all customer touchpoints

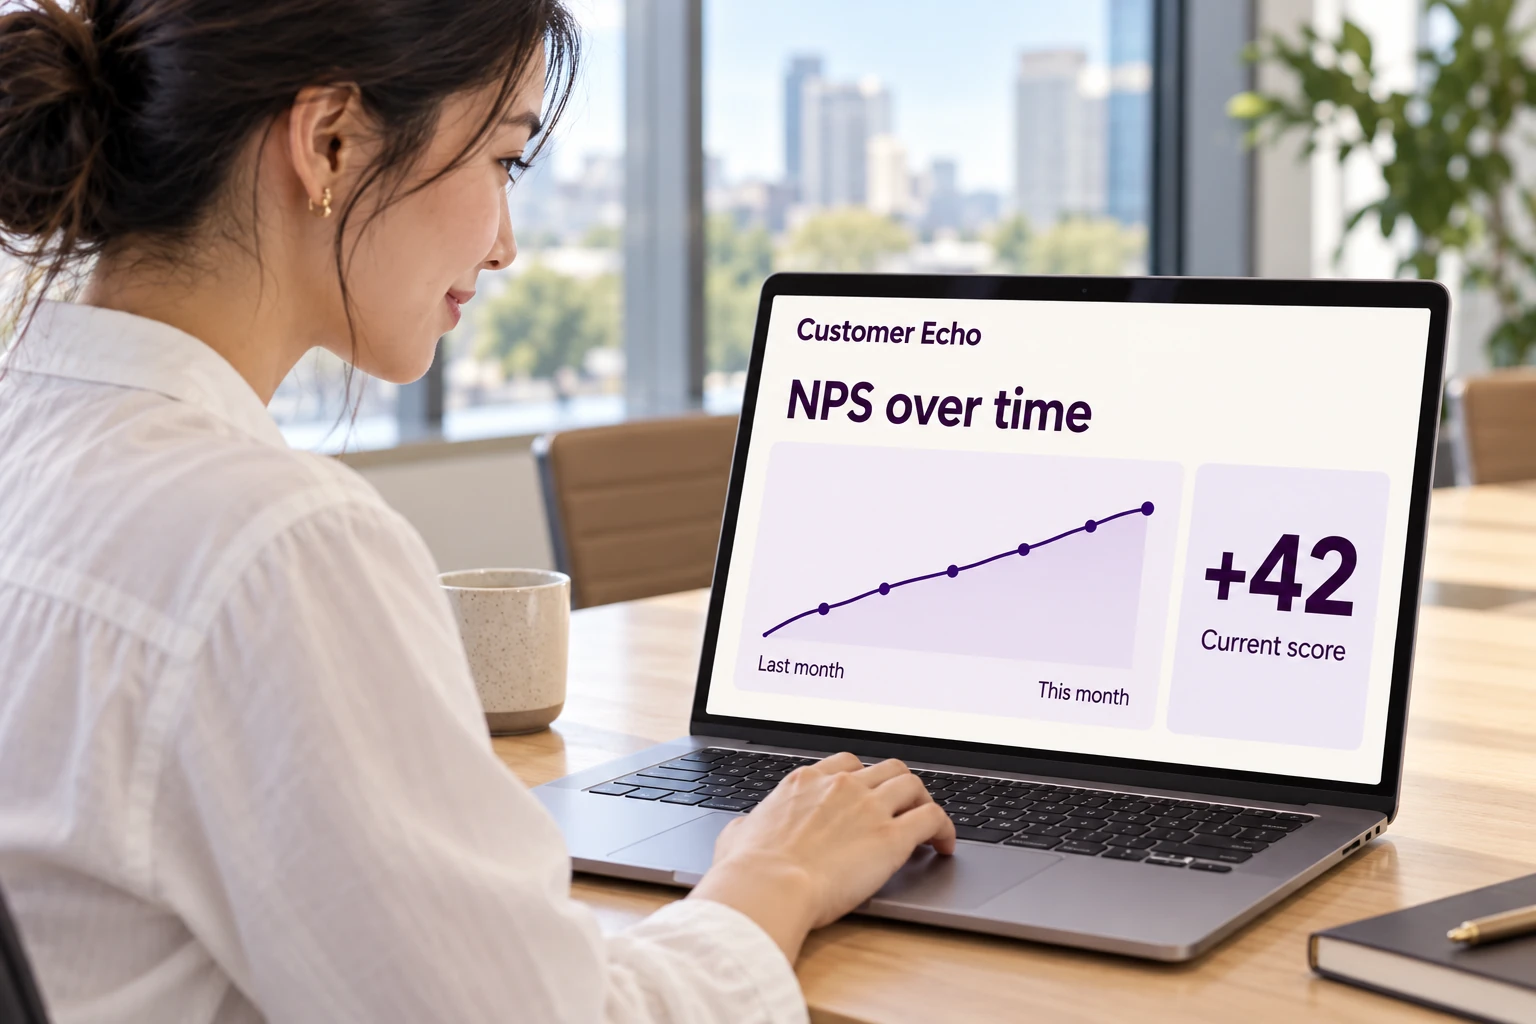
A manager reviewing a rising NPS score trend on a laptop beside a bright meeting-room window
Customer EchoCustomer scoresA clearer trend
  • Can track hotel guest satisfaction scores throughout their entire stay
  • Can monitor SaaS product NPS after each feature release
  • Can measure retail customer satisfaction by location and compare stores
  • Can track healthcare facility experience scores for operational quality metrics
  • Can monitor restaurant NPS in real-time and respond to dips immediately
  • Can compare B2B client satisfaction across reporting periods
  • Can track employee NPS (eNPS) for HR teams and culture monitoring
  • Can measure customer effort scores after support interactions

Your kind of business

See yourself here.

Choose your industry to see relevant photos and examples.

An independent service business owner inviting a visitor to share feedback beside a QR placard
Customer feedback

The team made everything easy to understand. Thank you!

Service

Preview unavailable

Preview · All businessesA little of everything